"Spatial intelligence" gets used loosely: sometimes it means a map, sometimes it means location analytics, sometimes it's just a rebrand of GIS. Underneath the buzzwords, there's a real and useful distinction from ordinary location data or dashboards.
Spatial intelligence is what you get when place-based data (documents, drawings, sensor readings, spreadsheets, regulatory constraints) is linked into one model that understands how those things relate to each other, and can be interrogated in plain english with an explainable, traceable answer.
01 Beyond Maps and Dashboards
Location intelligence and GIS tell you where something is. A dashboard can plot assets, sites, or sensors on a map and let you filter and zoom.
It's powerful, but usually the derivative of some expert analysis. The method may be lost or change, and the analysis stops at the geometry and its attribution. It doesn't know that this asset belongs to that project, that this reading contradicts a historical record three years old, or that this regulation applies here but not two fields over.
A spatial intelligence platform adds the relationships. It's the difference between a map with dots on it and a model that understands how those dots connect. Which entities belong together? Which records supersede others? Which constraints interact? All grounded in real spatial and organisational context that evolves with your business.
02 Why Generic AI Struggles With Place-Based Data
Chatbots are confident by default. Ask a general-purpose AI assistant a specific question about a site, an asset, or a regulatory constraint, and it will usually answer, whether or not it actually has grounded information to answer from. Without a structured source of truth behind it, that confidence is a liability, not a feature.
For decisions with physical, financial, or regulatory consequences, "confidently wrong" is worse than "clearly uncertain." That's why explainable AI matters specifically in this space: an answer is only useful if you can see where it came from.
03 The Building Blocks: Knowledge Graphs and Explainable AI
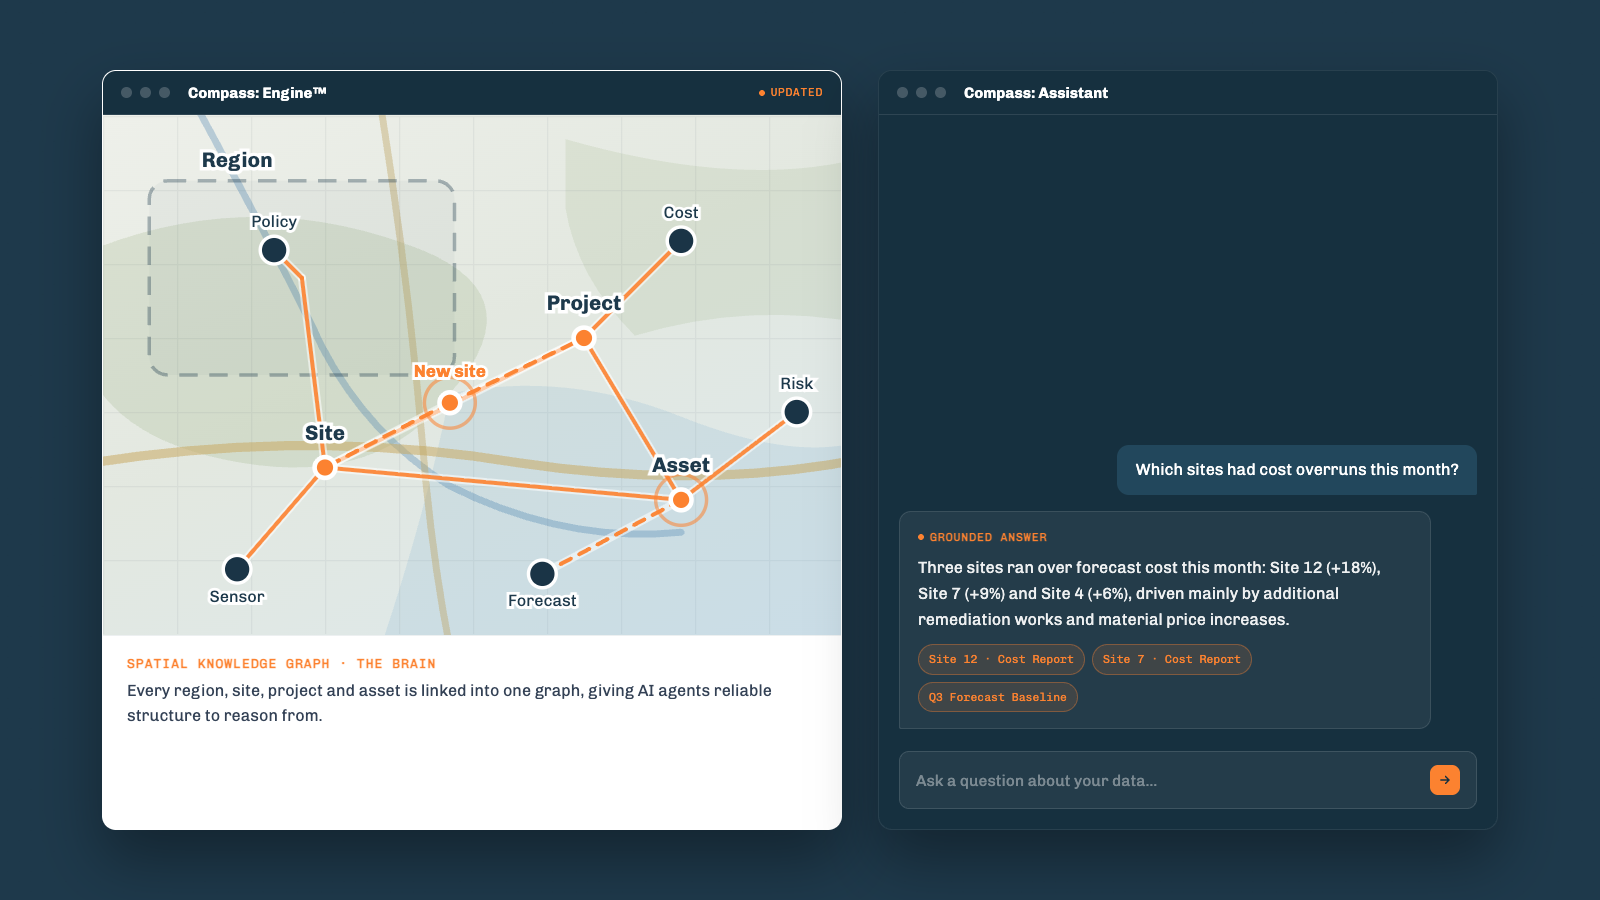
We build our spatial intelligence platform in four stages. Data is ingested and normalised regardless of source format (documents, CAD, spreadsheets, GIS files), so nothing has to be manually wrangled before it's usable. That data is then linked into a knowledge graph: a structured model connecting entities across space and time.
Organising data in this way means it is readily available for analysts and AI agents alike, to interrogate and build insights from. Every answer is anchored in a known, explainable relationship between concepts. This is the inflection point that transforms Spatial Data into Spatial Intelligence.
04 What This Looks Like in Practice
The same underlying model applies to very different problems. Compass: Terra turns borehole logs and ground investigation reports into a queryable site model. Compass: Locus applies the same approach to place-based delivery strategy, from climate adaptation and transport to energy-network connection. Compass: Res builds living portfolio intelligence across an entire property or asset estate. Where none of those fit exactly, Compass: Custom configures the same engine to a specific organisational challenge.
Different domains, same underlying shift: fragmented, siloed data becomes one coherent, explainable model that anyone in the organisation can query directly.
See spatial intelligence in action
Explore Compass: Engine™, the explainable-AI foundation behind every SimAnalytica product, or talk to our team about your own data.
SimAnalytica builds spatial intelligence infrastructure for organisations working in the physical world.